- Home
- Azure
- Messaging on Azure Blog
- Azure Event Grid's MQTT Broker Performance
- Subscribe to RSS Feed
- Mark as New
- Mark as Read
- Bookmark
- Subscribe
- Printer Friendly Page
- Report Inappropriate Content
Overview
Azure Event Grid is a pub-sub message broker that enables you to integrate your solutions at scale using HTTP pull delivery, HTTP push delivery, and the MQTT broker capability. The MQTT broker capability in Event Grid enables your clients to communicate on custom MQTT topic names using a publish-subscribe messaging model. This capability fulfills the need for MQTT as the primary communication standard for IoT scenarios that drives the digital transformation efforts across a wide spectrum of industries, including but not limited to automotive, manufacturing, energy, and retail.
Performance testing is a crucial aspect of software development, especially for services that manage large numbers of client connections and message transfers. Our team has been dedicated to assessing the performance of our systems from the early stages of development. In this blog post, we provide an overview of our testing approach, share some test results, and discuss the insights we have gained from our efforts.
Performance goals and latency highlights
To present the system operating at the current scale boundaries, the tests were conducted with a namespace with 40 throughput units (TUs). The following list represents the main scale limits that can be achieved using 40 TUs and the latency highlights from our tests shared in the blog.
- Maximum of 400,000 active connections.
- Maximum message rate of 40,000 messages per second for both inbound and outbound traffic.
- Latency highlights:
- P50 for QoS0 MQTT messages: 100 milliseconds.
- P50 for QoS1 MQTT messages: 110 milliseconds.
- P75 for QoS0 MQTT messages: 150 milliseconds.
- P75 for QoS1 MQTT messages: 160 milliseconds.
- P90 for QoS0 MQTT messages: 185 milliseconds.
- P90 for QoS1 MQTT messages: 195 milliseconds.
- Latency highlights:
- Maximum message rate of 40,000 routed MQTT messages per second.
- Latency highlights:
- P50 Latency: 65 milliseconds.
- P75 Latency: 95 milliseconds.
- P90 Latency: 145 milliseconds.
- Latency highlights:
- Maximum multiplication factor for broadcast scenarios of 40,000, allowing 1 ingress message per second ingress to turn into 40,000 egress messages per second.
- Latency highlights:
- P50 for QoS0 and QoS1 MQTT messages: 820 milliseconds.
- P75 for QoS0 and QoS1 MQTT messages: 1,200 milliseconds.
- P90 for QoS0 and QoS1 MQTT messages: 1,300 milliseconds.
- Latency highlights:
Note that the latency results in this report are end-to-end latencies for messages. They don’t represent a promise or SLA by Azure Event Grid. Rather, these results are provided to give you an idea of the performance characteristics of Event Grid under controlled test scenarios. Additionally, we are continuously investing in performance improvements to achieve higher scale and reduce latency.
Testing Environment
For solutions that use MQTT brokers to communicate, we should pay attention to the fact that we might be working with numerous small and unstable devices that talk on many changing channels determined by MQTT topics.We needed a test environment that could mimic all these devices and have the capacity to grow on multiple aspects that characterize realistic IoT solutions.
For our testing solution cluster, we chose Azure Kubernetes Services (AKS) because it has suitable features for managing and scaling our workloads. We simply put a certain number of simulated devices into one container deployed as a Kubernetes pod, as illustrated in the following image. The pods are running test runners with simulated publisher/subscriber devices that can talk to Event Grid MQTT brokers. The connection lines on the image are random examples, showing a possibility to use multiple brokers by some test scenarios. All the publishers and subscribers have MQTT connections to an Event Grid MQTT broker. Event Grid MQTT brokers can also have a message routing setup to send messages to an Event Grid topic. The routed messages are relayed to Event Hubs and then the test runners read them back to count them, measure latencies, etc. All the test runners are sending telemetry (logs and metrics) to a telemetry collection service. The metrics we collect are about operation and message processing counts and latencies. We put the metrics into one dashboard that lets us monitor test runs closely as they happen.
Scenarios
We split our test scenarios into communication models that we want to imitate. Here are the main scenarios that we have evaluated:
- Device to Cloud
- Device to Device
- Fan In Unicast
- Fan Out Unicast
- Fan Out Broadcast
Device to Cloud
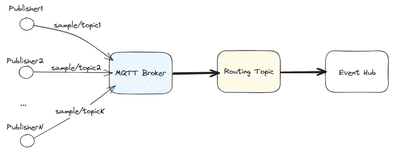
In this scenario, several publishers send messages to an MQTT broker that forwards all the messages to an Event Grid topic. Then, another Azure cloud component (Event Hub in our tests) can receive these messages.
Device to Device
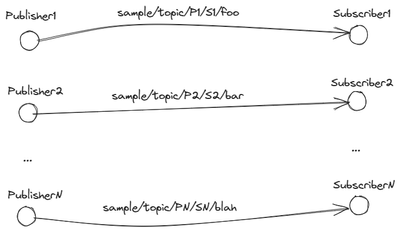
This scenario involves MQTT clients communicating with each other. Publishers are transmitting messages to specific subscribers and each channel of that communication has its own MQTT topic. The topics shown in the image are examples and there could be many incoming and outgoing communication channels used by publishers/subscribers.
Fan In Unicast
This scenario involves one subscriber that receives messages from multiple channels. The real tests have several groups of N to one communication groups, and the N value can change for different test runs.
Fan Out Unicast
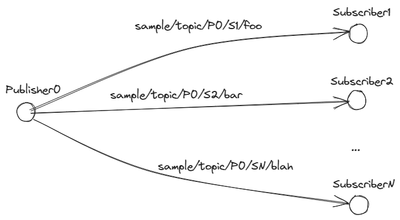
In contrast to the previous scenario, this one involves publishers sending messages on various channels (topics). Like the previous test, the communication clusters are repeated to achieve high numbers of clients and message rates.
Fan Out Broadcast
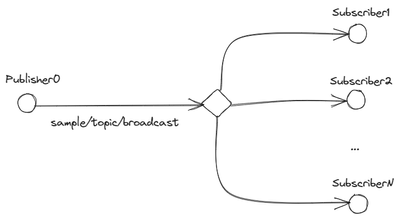
The broadcast scenario has one topic for sending messages and many subscribers for the same topic. The full test setup contains many clusters with one-to-many relationships.
Test Examples
400,000 connections, 40,000 messages/second, one namespace
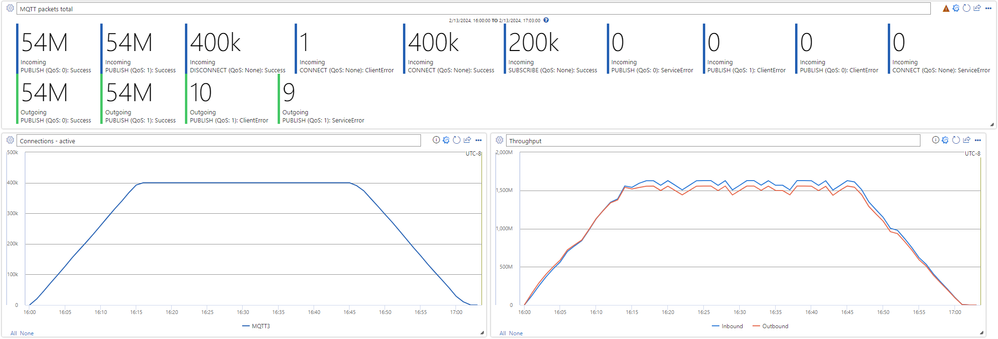
This is the device-to-device communication scenario with 200,000 publishers sending messages to 200,000 subscribers. The overall inbound/outbound message rates are 40,000 messsages/second. All connections belong to a single Event Grid namespace. Half of the messages are using QoS 0 and the other half QoS 1.
The connections are dialed up to 400,000 in the first 15 minutes and they are dialed down in the last 15 minutes of the test. All messages were routed to an external Event Grid topic and then pushed to an Event Hub. The test consumed messages from the external Event Hub to measure the total routed message latency. We also measured messages’ latencies from the time they were published by a publisher simulated device and received by a subscriber simulated device.
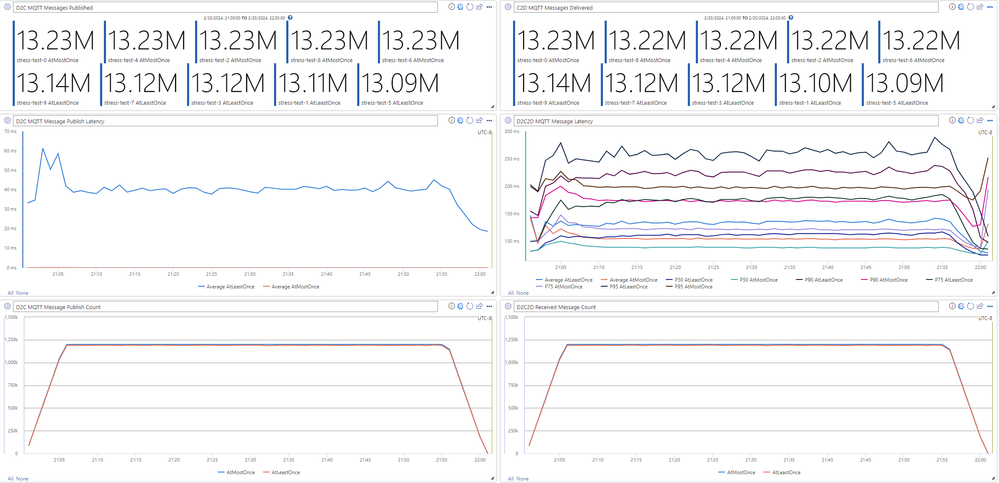
The above graphs show:
- Total numbers of published and received messages broken by QoS.
- Average publishing latency for QoS 1 messages.
- Message end-to-end latency broken by QoS and aggregations (avg, p50, p75, p90, and p95).
- Published messages (every minute) graph broken by message QoS.
- Received messages (every minute) graph broken by message QoS.
The above graphs represent routed messages:
- Received routed messages (per minute).
- Routed message end-to-end latencies (avg, p50, p75, p90, and p95).
- Total number of routed messages.
The above graphs show operations, active connections, and throughputs:
- Total number of different operations broken by QoS.
- Number of active connections (every minute).
- Inbound and outbound data throughputs.
400,000 connections, 40,000 messages/second, 10 namespaces
This test is like the previous one. The difference is that the connections and messages are equally divided into 10 namespaces. We can notice slightly better mqtt end-to-end and routing latencies.
The above charts are like the ones from the previous section. The only difference is that the total published/received message counters are broken per namespace, the other metrics are aggregated for all namespaces together.
As before, the routing metrics are like the ones from the previous test. The messages from all namespaces go to the same Event Grid topic and a single Event Hub.
The operations and connections charts show all 10 namespaces together.
200,000 + 200 connections, 1,000 times broadcast
This is a broadcast scenario – each publisher has 1000 subscribers who receive those messages on one topic. This means the outgoing messages are increased by 1,000 times.
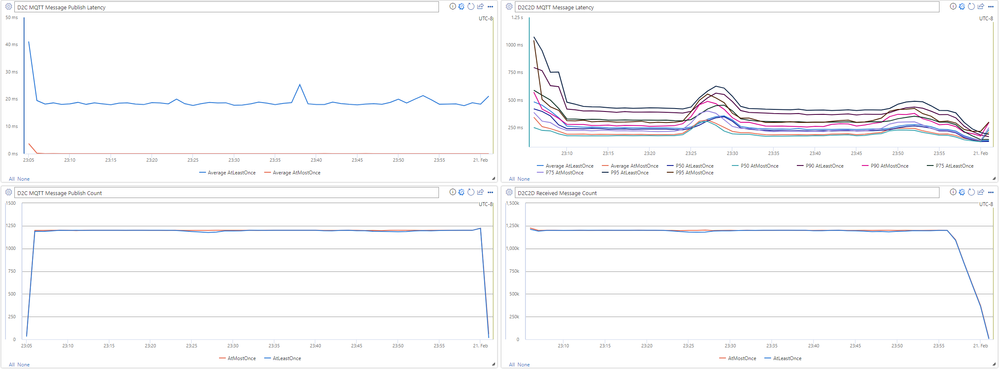
These charts show a couple of insights:
- End-to-end message latencies are higher compared to device-to-device scenarios. This is expected as broadcast messages are delivered with less urgency.
- When we compare the charts for published and received messages, it is evident that the number of published messages is a thousand times greater than the number of received messages.
The charts above indicate the lower number of active connections in contrast to the device-to-device tests. This makes sense as we have fewer devices that publish data. Throughput graph displays lower inbound values.
40,000 + 1 connection, 40,000 times broadcast
This test is a case of maximum broadcast, where one device that publishes messages sends one message every second and those messages are sent to 40,000 subscribers.
These graphs display the extra price to pay in the end-to-end message latencies, as they are additionally multiplied, and the ratio of published vs received messages of 1 in 40,000. The graphs that show the counters are displayed on the scale of minutes.
In conclusion, the above charts indicate an extremely low inbound throughput and the anticipated number of active connections.
Future Tests
We are continuously developing new capabilities and enhancements for our Event Grid MQTT broker. Our testing activities will concentrate on two areas:
- Ensuring that the system's performance characteristics are not compromised as we continue to introduce new features, such as Last Will and Testament and Retained Messages.
- Assist us in reaching new scale limits, as determined by the number of connections supported, message rates, and other factors.
Once we confirm our new achievements, we will continue sharing them with everyone.
Learnings
As you might expect, testing at this scale is not easy and comes with many difficulties. These difficulties can stem from both practical problems and product/test code reliability. Here is an arbitrary list of insights we gained while testing our services so far:
- We must ensure the test runs can be easily observed through emitted telemetry data and invest time into creating nice dashboards.
- It is crucial to have the ability to run tests with both flexibility and repeatability. This means being able to test new scenarios on a small scale, such as with a single runner on a developer's machine, or on a larger scale without needing to make significant adjustments to the test clients. Our AKS cluster provided us with the ability to easily scale up, allowing us to test with thousands of runners and achieve rapid deployments.
- It is essential to invest in telemetry and dashboards for the product side. Our tests have revealed a range of issues, from minor bugs to complex bottlenecks. These findings should be used to enhance our internal product observability, which will aid in the monitoring and troubleshooting of the overall system in the future.
- When tuning tests, it is important to limit the number of changes made to the parameters. Since the tests cover a broad range of areas, it is sensible to make only small, incremental changes so that the effects can be accurately attributed.
- It is especially important to prioritize customer scenarios when conducting tests. As the number of potential scenarios for a product like ours can increase exponentially, it is important to have a priority list to guide the testing process. The most effective way to prioritize is to focus on replicating known customer scenarios.
- It is vital to maintain the engagement of the team throughout the testing process. The performance and scale of cloud solutions are significant to all engineers involved in the design and development process. Therefore, it is essential to involve micro-service and software component owners in all stages of the testing process, from goal setting to troubleshooting.
- It is highly advantageous to share the accomplishments of reaching specific performance and scale milestones with all relevant parties. This invigorates and inspires your team members, supporters, and clients.
Resources
You can learn more about Azure Event Grid by visiting the links below. If you have questions or feedback, you can contact us at askmqtt@microsoft.com.
You must be a registered user to add a comment. If you've already registered, sign in. Otherwise, register and sign in.

