- Home
- Windows Server
- Containers
- Gain full observability into Windows containers on Azure Kubernetes Service using Datadog
- Subscribe to RSS Feed
- Mark as New
- Mark as Read
- Bookmark
- Subscribe
- Printer Friendly Page
- Report Inappropriate Content
This blog post has been co-authored by Microsoft and Kennon Kwok from Datadog
In today's complex cloud-native environments, observability plays a crucial role in effectively managing and troubleshooting applications. As organizations embrace microservices architecture and containerization, the need for comprehensive insights into the health and performance of their systems becomes paramount. This is where Datadog, an observability and security platform for cloud applications, combined with Windows on Azure Kubernetes Service (AKS), can unlock a new level of observability for your deployments.
Datadog overview
Datadog is a leading observability platform trusted by organizations worldwide. It offers a comprehensive set of tools and features to collect, analyze, and visualize metrics, logs, and traces, providing real-time insights into system behavior. With Datadog, teams can monitor the health and performance of their infrastructure, applications, and services, gaining actionable insights for efficient troubleshooting, capacity planning, and performance optimization. Datadog includes:
- Infrastructure Monitoring: provides metrics, visualizations, and alerting to ensure your engineering teams can maintain and optimize your cloud or hybrid environments. With extensive coverage of popular technologies, a simple deployment process that requires little maintenance, and an easy-to-use interface, Datadog helps teams communicate and troubleshoot more effectively.
- Application Performance Monitoring (APM): provides AI-powered code-level distributed tracing from browser and mobile applications to backend services and databases. By seamlessly correlating traces with logs, metrics, real user monitoring (RUM) data, security signals, and other telemetry, Datadog APM enables you to detect and resolve root causes faster, optimize application performance and resource consumption, and collaborate more effectively so that your end users get the best possible experience.
- Log Management: unifies logs, metrics, and traces in a single view, giving you rich context for analyzing log data. Whether you’re troubleshooting issues, optimizing performance, or investigating security threats, Logging without Limits™ provides a cost-effective, scalable approach to centralized log management, so you can get complete visibility across your stack.
With Datadog as your observability partner in Windows on AKS deployments, you can gain valuable insights into the behavior and performance of your applications. In the next section, we will explore how to effectively monitor and set up alerts using Datadog, ensuring proactive incident response and efficient troubleshooting in your Windows on AKS environment.
Datadog + Windows on Azure Kubernetes Service
Installing Datadog on your AKS cluster empowers you to gain comprehensive observability into your containerized applications. By leveraging Helm, a popular package manager for Kubernetes, you can easily deploy and manage the Datadog Agent, which collects metrics, traces, and logs from your AKS cluster.
Installation with Helm
AKS clusters with Windows nodes are created with a default Linux nodepool and one or more Windows nodepools. When using helm, 2 deployments are required to fully enable Datadog on an AKS cluster with a Windows nodepool.
Using the Datadog values.yaml configuration file as a reference, create your values files to configure the Datadog agents. The examples below enable the logs and APM trace collection features on the Datadog Agent, but many other features and options are configurable using the values file. Datadog recommends that your values.yaml only contain values that need to be overridden, as it allows a smooth experience when upgrading chart versions.
If this is a fresh install, add the Helm Datadog repo:
helm repo add datadog https://helm.datadoghq.com
helm repo update
Create the following values-linux.yaml file to enable logs and APM trace collection.
datadog:
  logs:
    enabled: true
  apm:
    enabled: true
  kubelet:
    host:
      valueFrom:
        fieldRef:
          fieldPath: spec.nodeName
    hostCAPath: /etc/kubernetes/certs/kubeletserver.crt
Retrieve your Datadog API and APP keys from your Agent installation instructions and run:
helm install datadog -f values.yaml --set datadog.apiKey= <DATADOG_API_KEY> --set datadog.appKey=<DATATDOG_APP_KEY> datadog/datadog
Create the following values-windows.yaml file. Like the Linux example, this configuration enables logs and APM.
targetSystem: windows
existingClusterAgent:
  join: true
  serviceName: "datadog-cluster-agent"
  tokenSecretName: "datadog-cluster-agent"
datadog-crds:
  crds:
    datadogMetrics: false
datadog:
  logs:
    enabled: true
  apm:
    enabled: true
  kubeStateMetricsEnabled: false
  kubelet:
    tlsVerify: false
Use helm to install the Windows agents:
helm install datadog-windows -f values-windows.yaml --set datadog.apiKey=<DATADOG_API_KEY> --set datadog.appKey=<DATATDOG_APP_KEY> datadog/datadog
These helm deployments add the Datadog Agent to all nodes in your cluster with a DaemonSet. It also optionally deploys the kube-state-metrics check to the linux nodepool and uses it as an additional source of metrics about the cluster. A few minutes after installation, Datadog begins to report hosts and metrics.
Datadog dashboards and in-app features
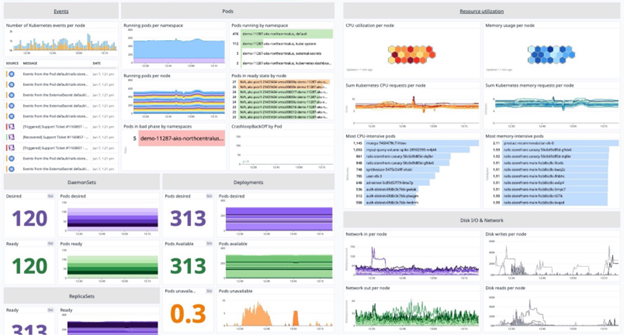
Datadog offers pre-built dashboards and visualizations tailored specifically for monitoring Windows on AKS workloads. These dashboards provide a comprehensive overview of critical metrics such as CPU utilization, memory usage, disk I/O, and network traffic. They allow you to monitor the health and performance of your Windows-based applications in real-time, enabling quick identification of issues and performance bottlenecks.
Datadog’s integrations make it straightforward to display health and resource metrics from Docker, Kubernetes, and Azure Virtual Machines on a single dashboard.
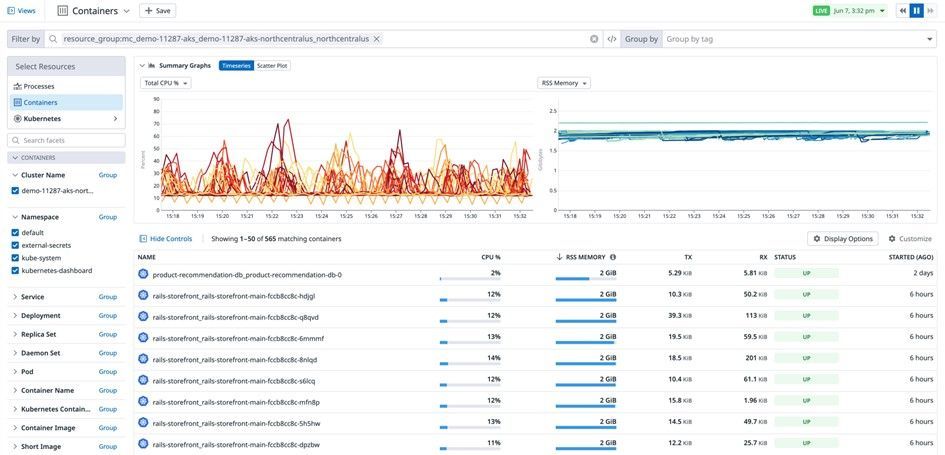
If you’re running hundreds or even thousands of containers in AKS, Datadog’s Live Container view can help you quickly sift through all the operational data flowing in from your deployment. The Live Container view provides real-time insights into the health, resource consumption, and status of every container in your AKS cluster. Resource metrics are graphed at two-second resolution, making it easy to identify containers that use, for example, excessive CPU or memory.
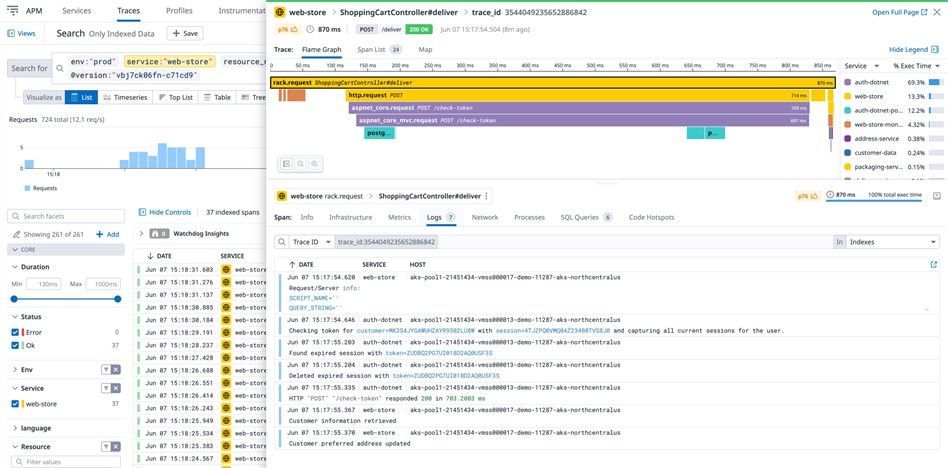
Datadog APM with correlated logs provides a comprehensive view of application performance and behavior. By correlating logs with traces, you can easily identify the root cause of issues, troubleshoot errors, and optimize performance, ensuring smooth operation of your applications in real-time.
Similarly, from a logs entry point, Datadog’s correlation capability allows you to quickly navigate to related traces.
Conclusion
Observability is essential for effectively managing and troubleshooting Windows-based applications running on Azure Kubernetes Service (AKS). In this blog post, we explored how Datadog, a powerful observability platform, can unlock a new level of insight and understanding in your Windows on AKS deployments.
By integrating Datadog into your Windows on AKS environment, you can streamline monitoring workflows, proactively identify and resolve issues, and optimize the performance and availability of your applications. With support for Windows containers and seamless integration with AKS, Datadog provides a unified observability solution tailored to your specific needs.
Sign up for a free trial of Datadog and empower your Windows on AKS deployments with comprehensive observability. For more information, check our the documentation on how to Install the Datadog Agent on Kubernetes and how to Instrument a custom method to get deep visibility into your business logic.
You must be a registered user to add a comment. If you've already registered, sign in. Otherwise, register and sign in.


